Blog
Discovering how people use their energy usage data
First published October 30th 2018, on the OVO Tech blog
—
Discovery phase is often an overlooked phase in agile delivery. But they can be incredibly valuable.
Discovery is like an investigation, a small phase of time to understand the landscape of our users, the business, the technology and other external factors such as legislation. A good outcome of a discovery may be to not do anything, or it might be to set up a product team to proceed to alpha and testing some hypotheses generated by the phase.
We’re beginning to implement more discovery phases in the work we do. We’ve had good success following a leaner approach of jumping into hypotheses testing, however some problems need further investigation to begin to define good hypotheses.
Energy Usage graphs
A common pattern among energy suppliers to illustrate how much energy you’re using in a graph format.

But why are these useful? How are they used? What do people use them for? We were struggling to answer these questions. We had heard anecdotal stuff like “I like looking for spikes” but why is that important?
Ultimately we didn’t know what needs the graphs and the energy usage data were meeting.
We had started sketching ideas of how we might improve on how we display energy usage data. However we found that our conversations kept coming back to trying to improve the graph solely based on our opinions. This wasn’t helping us. Without knowing the user need(s) graphs meet, we couldn’t have an informed conversation about how we might improve the display of energy usage.
If we had attempted to start by researching our proposed sketches we would have struggled to design valid research. We needed to learn more about how graphs are used today in order to design contextual usability research to test our proposed ideas.
Very Disco
We saw this as an opportunity to conduct a discovery. We adopted the Government Digital Service (GDS) definition of a discovery. Before initiating this discovery I thought the aim of it would be something like “understand the needs people have when reading their energy usage data”. But it seems that the best discoveries are not centred around getting understanding but focused on being able to make a decision, reading these tips from Will Myddelton really helped frame how to kick off this phase.
A cross-disciplinary team got together for a 90 minute workshop to thrash out what we wanted to learn, what we didn’t want to learn and things we needed to find out.
This covered:
Learn about the tasks that users complete with the help of their usage graphs.
Understand what technical limitations there were.
Regulations we needed to be aware of.
We ended our workshop with this shared goal:
to understand the tasks our customers complete with their energy usage data so that we can decide if there is an opportunity for OVO to better help our customers.
Finding answers
Over the course of 3 weeks we:
Found answers to the business and technical questions we had.
We conducted depth interviews with OVO customers.
Held a conversation on the OVO forum.
Analysed the findings from our user research.
We intentionally sampled users who are using their usage data more frequently than average. We hypothesised that by doing so we would learn about the advanced tasks that are able to be completed with energy usage data. In understanding these more advanced needs, we hoped we’d learn how we could make them simpler so more users could benefit.
Because research is a team sport it wasn’t just me, the researcher, conducting these depth interviews and analysing the findings. I was joined by different team members to listen and take notes during the research sessions, and then joined again to conduct the analysis.
This is important, it’s more effective than any playback of research can be in getting a shared understanding of the user needs. It removes biases in the research analysis, and exposing team members to research has been proven to directly improve the experience that we deliver.
Tasks that are completed with energy usage data
As with any discovery, we were surprised with what we found. We spoke with people who were able to conduct a number of really sophisticated graphs with their energy usage data.
We heard how people used the graphs we provide to:
Check that there is nothing untoward happening in their house.
Control their monthly outgoings.
Decide if there are any actions they can take to use less energy.
Measure the impact a change made has had.
However, we also learnt that it’s not just about the graphs, we heard stories of how people collated their own data into alternative formats or paired it up with other sources of data, such as their solar panel outputs, to make more meaning from their usage.
Doing so helped people to:
Make a decision about when to use an appliance.
Get better informed estimates of what other deals would cost.
Tune household appliances to get to the optimum settings.
Ascertain whether something was worth investing in.
Decide if they should change an appliance.
Understanding that there are these range of tasks that can be, and need to be completed in the pursuit of energy efficiency is helping us define new hypotheses that we want to test. As suspected, it’s not really about making great graphs but actually about presenting the data in more usable ways.
More disco
Taking the time to really investigate an area to enable us to define better hypotheses is certainly something that we’ll be doing more of. By having an understanding of the tasks that users are completing with their energy usage data we are having better conversations around what improved usage data could be like. Before, we were too heavily centred around trying to improve the graphs which would have not had a great impact on meeting our user needs.
From this discovery we’ve learnt (maybe somewhat obviously) that trying to spin off a discovery on the side of the main focus of the product team is not the most effective way in which to get a shared understanding. We were left balancing this work alongside other competing team requirements. But this discovery has now given us a model on which to base and evolve the next one.
Participant Experience Discovery Findings
First published January 2018, on Medium
This blog post is the result of a People Thinking project with Nic Price
—
What’s it like to be a user research participant?

Participants have needs when they are in a research interview. The words we use to set the scene can affect the participant’s understanding of what is being asked. The method of gaining consent can affect the participant’s comfort which will impact on how much they may divulge. What is less clear is the impact that the whole journey of taking part in research can have on our chances of getting the best insights.
A hypothesis
Participants have needs when they take part in research, if we meet these needs then we will get good quality insights, however those needs are not being met as well as they could so as result insights aren’t as good as they could be. If we discover what it’s like to be a research participant then we will be able to identify how to better meet those needs.
Additionally user research is still misunderstood, if we promote understanding of what user research is within our project and product teams by communicating from a participants view we will increase overall quality of user research.
What did we do? (a.k.a Methodology)
We had one research question
“What is it like to be a user research participant?”
To answer this question we drew up a research plan that broke that question into four;
What do user research participants need and when?
What’s it like to be a participant in a user research interview?
Are these needs being met today, how and by who?
How might we better meet these needs, and what would happen if we did?
Our participants for this research were people who:
had been participants
recruit participants
conduct user research
People who had been participants
This was further broken down into
Why do you take part in research?
What influences you taking part in research?
How do you feel when you take part in research?
What do you understand to be happening during the research?
Do you ever walk away wishing you’d said something else?
We used these questions to design a discussion guide. We conducted 5 x 30 minute depth interviews over the phone with people who had taken part in user research in the last 3 months. Participants in these interviews received a £25 incentive via bank transfer (handled by the recruiter)
We then took themes from these interviews to design a survey. The survey was administered via survey monkey and emailed to a database of people who have signed up to take part, and have taken part, in User Research. it was open for a week and achieved a response rate of 903. Respondents to the survey were entered into a prize draw for 4 x £25 Amazon voucher (handled by the recruiter).
People who recruit participants
We conducted contextual inquiries with a recruitment organisation.
People who conduct User Research
We conducted 3 semi-structured interviews with people who have conducted user research. This helped form our discussion guide for participants but themes from these interviews did not directly form the findings.
Limitations
There are limitations in the research, all our interviews were conducted remotely and they were all recruited via the same recruiter. The survey was sent to a ready engaged database of people and was conducted digitally. By its very nature, all those that took part had been participants previously (Very meta).
What did we find out?
48% of participants wouldn’t take part in a piece of research over Skype (video call)
Conducting your research over video call will exclude those who don’t have the technical ability in which to use that channel. It’s also seen as a intrusive method as it involves seeing into the participants environment.
If the research topic is sensitive or emotive it maybe that a video call is less success as participants report they can’t express themselves as well or connect with the researcher. This is a familiar finding in other video call research, the theory of social presence describes the need for a good quality communication medium when communicating.
41% of participants wouldn’t take part in home visit research
Similarly to video call interviews, home visits are intrusive but also feel dangerous to the participant inviting a stranger into their home.
But it’s not just the awkwardness of having someone come to your house. We need to be aware of the living arrangements of the person. Do they live in a busy household or shared accommodation therefore having the interview at their home may be unfair on those others in the house.
The non-video call and non-home visit populations overlap, in places.
As can be seen from the reasons for not having a video call or home visit interview there is some overlap in the reasoning. However that doesn’t mean that these populations are the same. There is an overlap, approximately a third of those that said they wouldn’t take part in a Skype interview also said they wouldn’t take part in a house visit interview.
A significant amount participants dislike the focus group method
Focus groups are seen as “competitive, restrictive and shouty”. As a result 15% of participants don’t want to take part in them, but a significant amount of the survey rated it as a method they disliked when compared to other methods.
For those that take part in research to be heard and make a difference say that the focus group is not a method in which they can do this.
The more research you take part in the more positive you are about research methods and environments
We need to be cautious of this due to the limitations in the research, however people are positive about taking part in research. As a result they want to take part in further research. They tell their friends and family about this too which leads to more people taking part in research. From our sample 44% of participants had been referred on by a family/friend/colleague.
We need to be aware too of the blockers to taking part in research:
Logistics
Bad parking was often cited as a pain. Just planning the journey to the research session and the stress that incurs can block people from taking part, or taking part with their whole selves .
Health
Health conditions, physical or mental, create barriers to taking part in research, suffering from agoraphobia — a fear of situations that may make you feel helpless or embarrassed — can prevent a participant from getting to and taking art in research.
Work
Approximately a third of people work 9am — 5pm (the Dolly Parton shift). User Researchers form a large part of this group therefore research is likely to take part between 9am — 5pm which immediately biases against those working that short pattern.
1 in 5 participants think of something relevant to add to the research after taking part.
Most user research sessions last 60 minutes, keeping participants longer would lead to fatigue. However, answering questions that you didn’t expect in a time pressured manner can be difficult. Therefore participants continue to think about the research questions and think of something that they would of wanted to say after the session has ended. They could have provided more to the session with more time or with more preparation.
Linked in with this is a sense of not seeing the value my insights offered. Participants take part in research to make a difference but often don’t see the impact sharing their stories had. It doesn’t satisfy their reason for taking part, neither does it provide closure to the research journey.
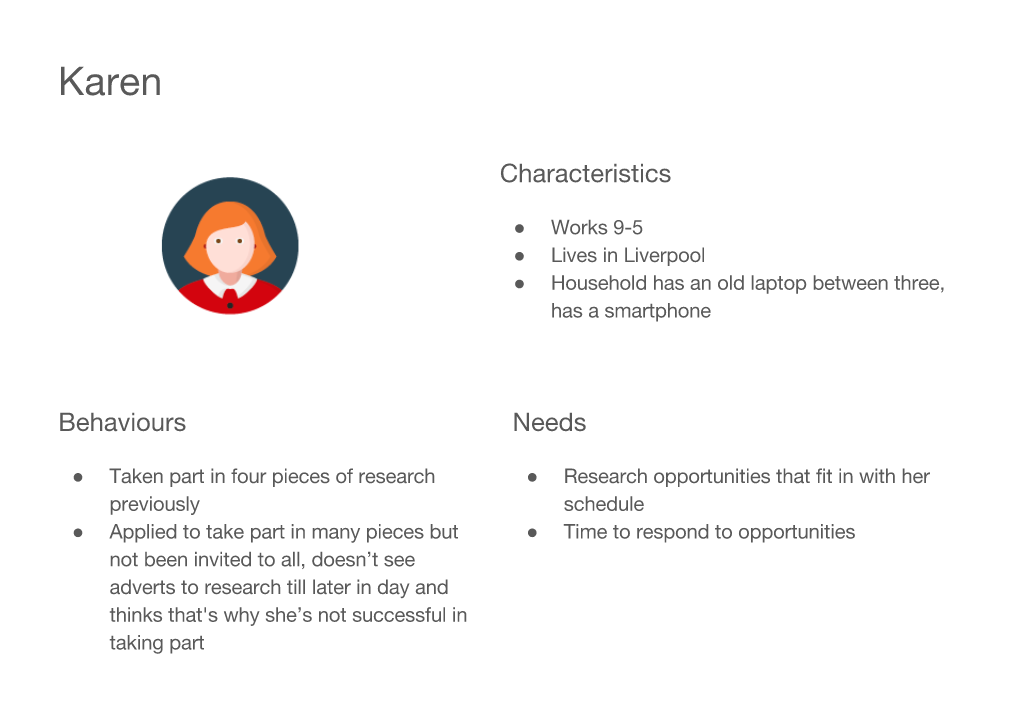
Meet Karen and Ron
We created personas to help us when we are designing our research opportunities.
Hello Karen
Hello Ron

So what does this all mean?
No research method is bad, this doesn’t mean you should stop doing Skype interviews. What it does mean is a reliance on a single method of research is bad and will bias your results.
Research doesn’t stop when the camera is off. Participants continue to think about research after the session. How might we capture those thoughts, additionally how might we conduct sessions which are less surprising and allow participants to prepare for them in a way that suits their needs.
Taking part in research is good, share that message to get others taking part in research.
We’ll be sharing shortly what the journey of a participant is like and the tasks they need to complete. In this we’ll explore further the pre-research nerves that participants feel and how that might be mitigated.
There are many questions that are left unanswered, some of those are:
What is the experience when participants are recruited via a different method/recruiter?
How do other user researchers conduct research? And how is this impacted by different sectors?
Why haven’t people taken part in research when offered the opportunity?
Participants have needs
First published January 2018, on Medium
This blog post is the result of a People Thinking project with Nic Price
—
What’s it like to be a user research participant?
This is a question we (Ben Cubbon and Nic Price) asked ourselves. And it became clear we didn’t know the answer.
So we kicked off a discovery to better understand the participant experience.
Our hypothesis was that by better understand the needs that participants have when taking part in research, we will be able to improve the design of our research, which will lead to better quality insights.
In addition to gaining better insights, we felt that by showing what research is like from the participant’s point of view we could promote a shared understanding of what research is across multi-disciplinary teams.
The participant journey is much more than just the research day.
To understand the research participant experience, we:
Conducted 5 in-depth interviews with participants
Spent a day observing a participant recruitment team
Surveyed 903 research participants
Through this we discovered the participant’s journey starts when they encounter an opportunity to take part in research. The journey doesn’t finish until days after the actual research session. You can read up on the needs we discovered.

Take part in a qualitative research interview task model
We shared the findings of this discovery at UX Bristol 2017. At the workshop we said we would be going into Alpha, and that time has now come.
Improving the participant experience
This is the beginning of taking the participant experience into Alpha where we will be testing out the following hypotheses that we came out of discovery with:
If we describe what user research is, and what the different research formats are, to potential participants then more people are likely to take part in research and feel less anxious when they do
If we provide a mechanism for participants and researchers to communicate after a research session has finished then better insights will be gathered by the research team, and participants will feel like their input has more value
If we inform user researchers of the biases and limitations that a research format can place on a participant then user research will use multiple formats when conducting research which will increase the diversity of participants and improve the quality of the insights for a project